In terms of ease of use and how the whole ErgVideo system works in conjunction with the training plan it can't be faulted. What will be interesting will be to see what kind of shape I am in at the end of the 20 weeks!
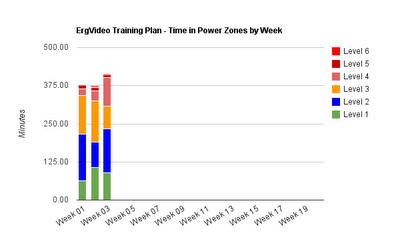
This week's plan included 2 threshold sessions ridden at 100% of FTP which was a very significant introduction into the plan and which left me feeling a bit tired but I seemed to recover Ok. If you look at the time spent in the power zones and the percentage of total training time spent in those zones you can see that there was indeed a big jump in intensity, I wasn't imagining it!
If you would like to view the graphs below on their original spreadsheet, which shows the actual percentages and numbers etc. when you hover over the columns use this link and simply click on the tabs at the foot of the page that opens to view the graphs.
On top of the significantly raised intensity there was also an increase in absolute total training time and as you can see all this resulted in an overall modest rise in the overall average HR for the week which comes as no surprise.
Finally considering the total work done for the week and the overall training stress score, as expected both have risen significantly in week three.
So, all in all a challenging week with increases across the board in pretty much everything one can measure when monitoring a training programme. Next week looks to again be challenging but with a substantially reduced overall training volume though there are again 2 threshold sessions scheduled to be ridden at 100% of FTP, now won't that be fun!


No comments:
Post a Comment