This was an interesting session, another ErgVideo ride using the motorpacing video which is a hard session. I'd planned the session to deliver a TSS of around 80 which is exactly what it did. The variations in effort during these session make it pretty challenging and the two hard efforts at around 600W make for a particularly uncomfortable time. On top of these as you can see from the file there are a couple of long efforts at well above my threshold so all in all a tough time for me.
However, some of the data coming out of this does serve one purpose and I thought I would post the results here. There is nothing new in this information but I thought I would share it as it is such a good illustration of the point.
The point is the value of using a power measuring device (either turbo or bike mounted) to gauge training efforts. I've produce bar charts of the heart rate and power distributions of today's session with the distributions shown in my heart rate and power training zones. If we look firstly at the heart rate distribution you can see that I spent the majority of this ride in my tempo and threshold heart rate zones so on the face of it, based on heart rate alone, this was not too bad a session at all. Essentially there was nothing in either zones 5 or 6.
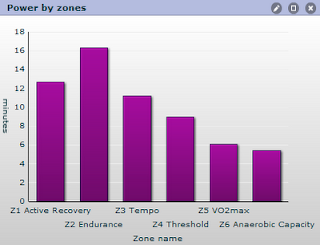
However, looking at the distribution of the actual power data from the workout we see something quite different:
We now see that very significant periods of time, in power output terms, were spent in my VO2 Max (L5) and anaerobic capacity (L6) training zones and this changes the real character of the workout completely. One workout, two different impressions of the physiological systems that will have been challenged by the workout and perhaps quite different recovery might be expected if one knows that significant work has been performed in zones 5 and 6, which was not apparent from the HR data alone.
To review the session data: click here.


No comments:
Post a Comment